Author: Keerthana Govindarazan
École des ponts ParisTech, Paris, France
DOI : https://doi.org/10.48568/rwvw-wh32
[Résumé : La réalité virtuelle (RV) peut être impliquée dans plusieurs aspects de la conception architecturale en raison de sa capacité inhérente à présenter des espaces en 3D d’une manière différente. Explorant une des facettes de cette technologie émergente, cet article examine certains des caractéristiques de la RV basée sur le Web et explique pourquoi elle est particulièrement bien adaptée pour constituer un outil de recherche sur les comportements pour le processus de conception architecturale. Cet article décrit un prototype de RV Web développé à l’aide de Rhino 3d, Grasshopper et VR Edge. Ce prototype est ensuite mis en œuvre avec succès dans le cadre d’une expérience avec 10 participants. L’article présente également les données spatio-temporelles et leru visualisation. Enfin, des orientations futures, concernant des domaines de recherche et d’amélioration, sont discutées.]
[Abstract: Virtual reality is being involved in various aspects of architectural design owing to its inherent ability to present 3d spaces in an unparalleled way. Exploring another facet of this emerging technology, this paper investigates some of the attributes of web-based VR and makes an argument for why it is particularly well suited to be utilized as a behavioral research tool in the architectural design process. A Web VR prototype developed using Rhino 3d, Grasshopper and VR Edge is outlined. The prototype is then successfully demonstrated in an experiment with 10 participants where spatiotemporal data was collected and the visualized data is illustrated. Finally, future directions including areas of further research and improvement are discussed.]
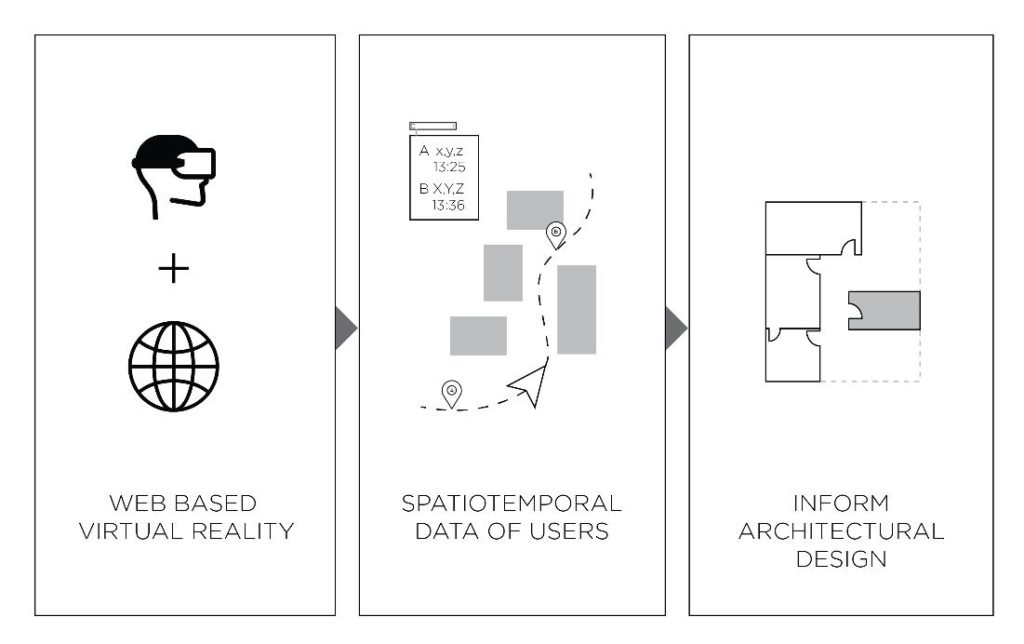
Figure 1 – Illustration of the proposed idea – Behavior analysis of architectural designs using Web VR.
1. Introduction
A digital simulation of a three-dimensional model that provides an immersive experience for the user using a head-mounted display (HMD) or a physical installation (CAVE – Cave Automatic Virtual Environment) is called Virtual Reality (VR) and this intrinsic characteristic of VR, makes its application in architecture promising. With VR technology becoming more affordable and requiring less expertise to use, its role in architecture cannot be ignored [1].
In addition to being used as a 3D visualization tool, VR is also being applied in other aspects of design. Building Information Model (BIM), along with its multiple layers of data was visualized in a VR system to help teams communicate discipline-specific concerns for a construction project[2]. A study demonstrated that communicating architectural forms and spaces to clients/non-architects through a VR model was more effective than traditional 2D representations and physical models [3]. One hospital interior design project used VR as a participatory design tool to incorporate user needs in design decisions [4]. Design studios are also exploring VR’s application in helping students understand spatial proportions and assessing its creative impact on students [5]. This article explores the potential of VR, particularly web-based VR, to observe the behavior of users in architectural designs presented virtually. As clients experience a design immersively, they read visual cues, move around a virtual space and are affected emotionally. Knowing how users navigate within a spatial prototype during the design process could help architects and urban planners involve end users to get objective feedback, crucial for evolving a user-centered design. Figure 1 illustrates the idea outlined here.
Web VR is an immersive virtual reality experience delivered through a webpage, which requires a VR compatible web browser (e.g.: Google Chrome, Mozilla Firefox, Microsoft Edge), a smartphone and any HMD to house the phone. While specialized VR installations and devices have been used to study human behavior in a simulated architectural space, the focus here is on demonstrating the advantages of Web VR as a behavior analysis tool. This is achieved by identifying a low cost, accessible-to-all web-based VR system capable of converting 3D models into VR experience and extracting movement data of the users.
Rhino 3D (a CAD software), Grasshopper (a visual programming plugin for Rhino3D that aids in generating design algorithmically) and VR Edge (a plugin for grasshopper) constitute the prototype proposed in this paper. The prototype, along with a tracking app built to acquire users’ position data, was tested in an experiment conducted with 10 participants.
In the next section, the motivation for developing such a behavior analysis tool is explained. The section that follows lists out the advantages of Web VR by highlighting key traits that prove beneficial. A prototype tool, consisting of software familiar to the architectural community, is then explained. The following section discusses the experiment that was conducted to test the prototype and present its results. The final section of this paper highlights the key takeaways, lays out directions and defines questions that need to be answered with further research.
2. Motivation
The Italian architect Luigi Moretti described architecture as a complex system of parameters with quantifiable values that in relation to each other compose forms meant to perform both structurally and functionally well [6]. These parameters broadly categorized into structural forces, spatial functions, anthropometric requirements, environmental conditions, financial constraints, government regulations, artistic statements and expressive features, are the major driving forces of design in architecture, old and new. While buildings are carefully evaluated using these measurable criteria for construction worthiness, the experiential component of a space, that determines the behavior and emotion of its occupants, is overlooked. The most common practice to evaluate a building’s experiential quality is through ‘Post-Occupancy Evaluation’ (POE).
Attributed as the ‘intangible’, the power of a space to guide behavior, motivate movement, affect emotions and define lifestyles has long been acknowledged in both older literature and in modern studies. Kevin Lynch provided insight into the components of a city dweller’s mental maps to guide urban designers [7]. Camillo Sitte deduced that a successful plaza must be centrally located to other buildings as people preferred enclosed spaces for public activities [8]. Christopher Alexander in his book “Pattern Language » has listed over 250 design principles for architects and urban planners [9]. Cozy fireplaces are said to provide a sense of community [10]. Ceiling heights are proven to affect the information processing ability of people [11]. Art in emergency waiting rooms is capable of producing positive impacts [12]. Where architects, while incorporating these suggestions and principles into designs, would benefit from user-feedback concurrent to the design cycle, they depend on environment-behavior research and POE conducted on existing buildings to verify if their design intentions direct the user interaction with the built environment. There is not a prevalent way to quantitatively evaluate and measure human responses and behaviors before deeming a design optimal for user satisfaction though there is an increasing demand for data-driven designs.
The core of the problem in understanding architecture and its effect on humans, as Dr. Edelstein points out, is:
‘It is often suggested that the complexity of architecture makes impossible the reduction of the human interaction with built settings to measurable parts… Historically, architectural research relied on philosophical constructs or analysis of behavior patterns in order to relate human responses to design’. [13]
Notwithstanding, inroads have been made in trying to quantify physical and emotional response to architecture. In the realm of neuroaesthetics, researchers were able to show through fMRI (Functional Magnetic Resonance Imaging) imaging of the brain that people preferred contoured curvilinear surfaces to angled forms [14]. One study established that human behavior and physiological response could be synchronously recorded using CAVE VR and biosensors, to help create healthy environments [13]. EEG (Electroencephalography) along with semantic differential survey was used to study people’s physiological and psychological response to color which was programmed into a dynamic VR adaptive system for interior design coloring [15]. Various other studies have taken fruitful efforts to shed light on the emotional effect of architecture [16] addressing John P. Eberhard’s inspiring questions about bridging the gap between neuroscience and architecture.
‘…Neuroscientists are quick to caution that adequate (neuroscientific) knowledge is not yet available to substantively inform design decisions as evidence based. Nonetheless, one cannot resist thinking, “what if?” while pondering exciting new possibilities… Can we use neuroscience to establish a framework for design decision-making?’ [17]
Creating awareness of these novel evidence-based practices and assisting more architects to contribute to this discourse would lay the groundwork for the seamless transition of such methods from research to mainstream design. Investigating alternate, reliable tools that do not involve expensive equipment and mastery of difficult skills is one way to enable such an approach. Web VR can help democratize the culture of human-centered data-oriented designs with cost-effective ubiquitous tools.
3. Web-based VR
Web-based VR, where one experiences virtual reality with an internet browser, as a technological advancement was developed with the goal of bringing VR experiences to the masses. A VR environment packaged as html (Hypertext Mark-up Language) files is uniquely positioned to be a behavior diagnostic tool in architecture. This section discusses some characteristics of web VR that make it particularly well suited to this end.
3.1. Affordable
The hardware requirements of a web-based VR experience are minimal. It profits from putting to good use the small powerful computers already in the hands of a large population – smartphones. A cost-effective HMD, for instance a $5 google cardboard, will be the only additional gadget needed. There is no need for a hand-held controller to navigate this type of VR scene loaded on a browser. Modern day browsers are already VR compatible and do not need any additional plugins.
3.2. Easy to distribute
The availability of hand-held devices and the ability to share this experience by linking a web address let distribution to people/clients all over the world to be unparalleled. Quick production, seamless sharing and an instant user feedback will amount to a very small portion of time and budget allocated for a project.
3.3. Data Possibilities
The web comes with an inherent benefit of web usage analysis. Moving within the scene from one location to another is done using clicks. Web analytics like measuring clicks and engagement with Web VR content can be exploited to learn about user behavior. Using a phone’s gyroscope, rotational orientation of users (which indicates what a person is looking at in VR) can also be mined. With the growing popularity of fitness trackers and smart wearables in the consumer market, health data like heart rate, could also be amassed to inform the emotional reaction of users, especially as accuracy of this data improves [18]. This could prove to be a valuable addition to the data sets within the reach of an architect as our understanding of such data in relation to architecture grows deeper. Unlike data from self-reporting studies, this type of quantitative data can help understand how a user experiences a design more objectively. Through the internet, it is also possible for large-scale public projects to reach its numerous end users/citizens and gain large quantities of data to support an evidence-based design process.
These properties of Web VR and the scope for data justifies evaluating its capacity for analyzing behavior in architecture. Studies [13], [15] that record emotional reaction of humans use sophisticated VR as the source of stimuli. To hypothesize that Web VR could act as a substitute to the refined VR, a prototype that explores the capabilities and tests the limits of Web VR needs to be identified.
4. Prototype
This section highlights the selected software used to create the web VR scene, describes the nature of the VR experience and the tracking app used to collect spatiotemporal data.
Rhino 3D is a 3D modeling software widely used in the architecture community. Grasshopper is a popular visual programming environment that runs within Rhino letting computational designers design algorithmically. VR Edge, a Grasshopper plugin, is used to generate the Web VR experience. With the permission and assistance of Noumena (developer company of VR Edge), the user-tracking app, in its development stage, is used for this study as part of the prototype. This system of software was chosen as it takes advantage of an architect’s general technical capacity (especially parametric architects) instead of using external platforms that might be unfamiliar and require additional skills.
Figure 2 depicts the production pipeline of the prototype and its implementation as a behavior analysis tool. The prototype framework is defined in 3 stages. Stage 1 involves producing the Web VR experience, stage 2 tracks and collects users’ spatiotemporal data and stage 3 visualises and analyses the data collected to assist in the design process.
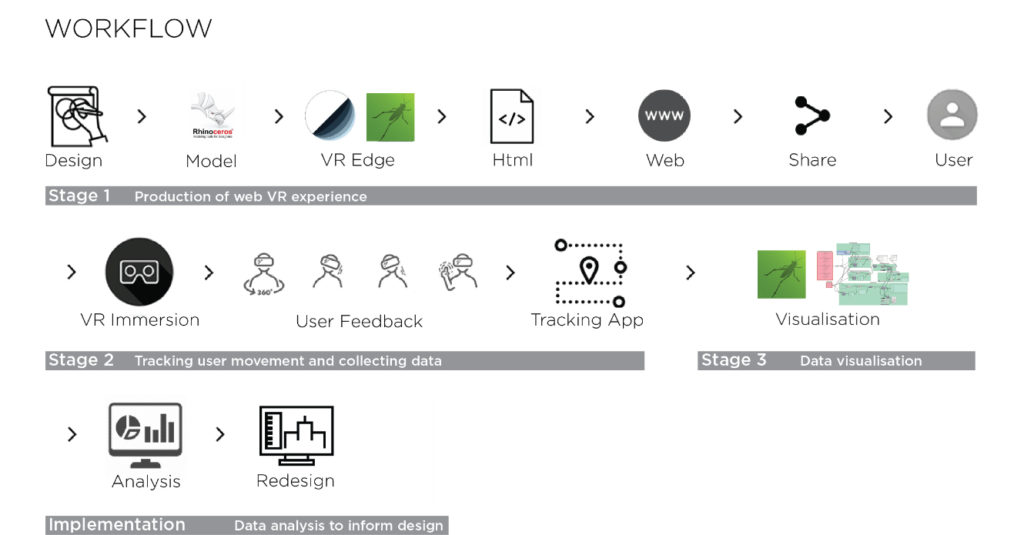
Figure 2 – Production pipeline of the prototype and its implementation.
4.1. Stage 1 – Production of web VR experience
The building to be visualized in web VR is modeled in Rhino 3D. External models can also be imported to Rhino. This rhino model acts as input for VR Edge. Following the grasshopper code from VR Edge’s documentation (https://vr.noumena.io/), a VR view of the model is produced. The output from the VR Edge plugin is a HTML file and multiple JSON (JavaScript Object Notation) files of the model. These files are uploaded to the web server and shared to the user. The web VR experience is created and shared using Rhino 3d and VR edge in this manner.
VR Edge produces a VR scene that can be navigated by way of ‘teleportation’. It transforms the floor of the model into a grid of boxes, called VR Boxes (Figure 3), each of which acts as a point in the scene that the user can move to. The VR scene comes with a cursor pinned to the center of the screen (Figure 3). This cursor triggers a click action when made to hover long enough on a box on the VR floor to which the user intends to move to. Teleportation method of locomotion in a virtual space lets users leap from point A to point B without traversing the physical space between them. This offers a hands-free movement within the experience.
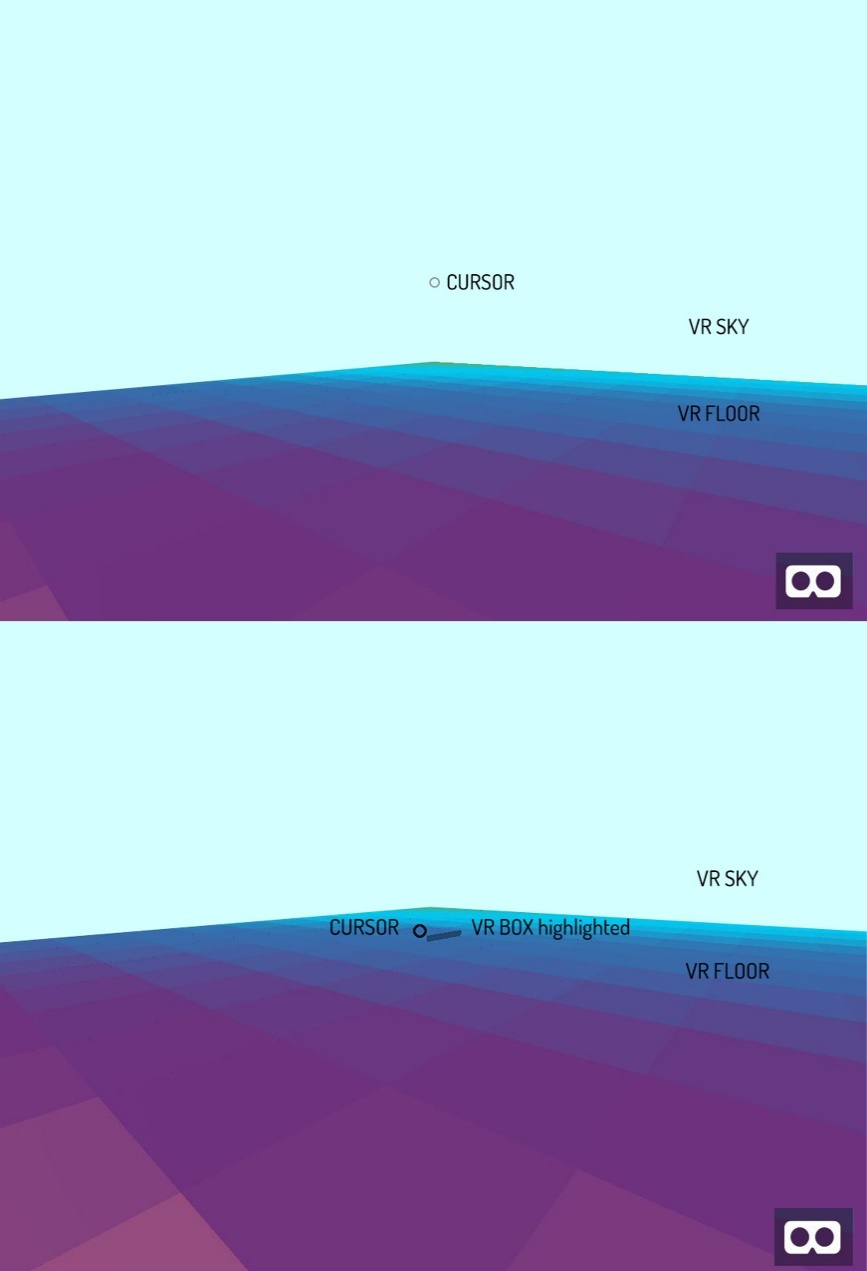
The floor has a grid of VR Boxes discernible by its color gradient. Top image shows the circular cursor pinned to the center of the screen. Bottom image shows how the cursor highlights the VR box when hovered.
4.2. Stage 2 – Tracking user movement and collecting data
Users’ movement data within the web experience is collected using a ‘Tracking App’ (developed by Noumena). It is achieved by developing an API (Application Programming Interface) in Node.js (a JavaScript runtime environment) and A-frame web frameworks. The tracking app records the coordinates of the points that are clicked on the screen in real time along with the timestamp of the click in Robomongo, a database manager (Figure 4). This provides information on where a person moves within the visualized architectural space and how long they spend in each location /VR box. This tracking feature is in development and has not been integrated within VR Edge yet. Currently, the app runs on a local server (as it is unpublished) and is accessed via a local port.
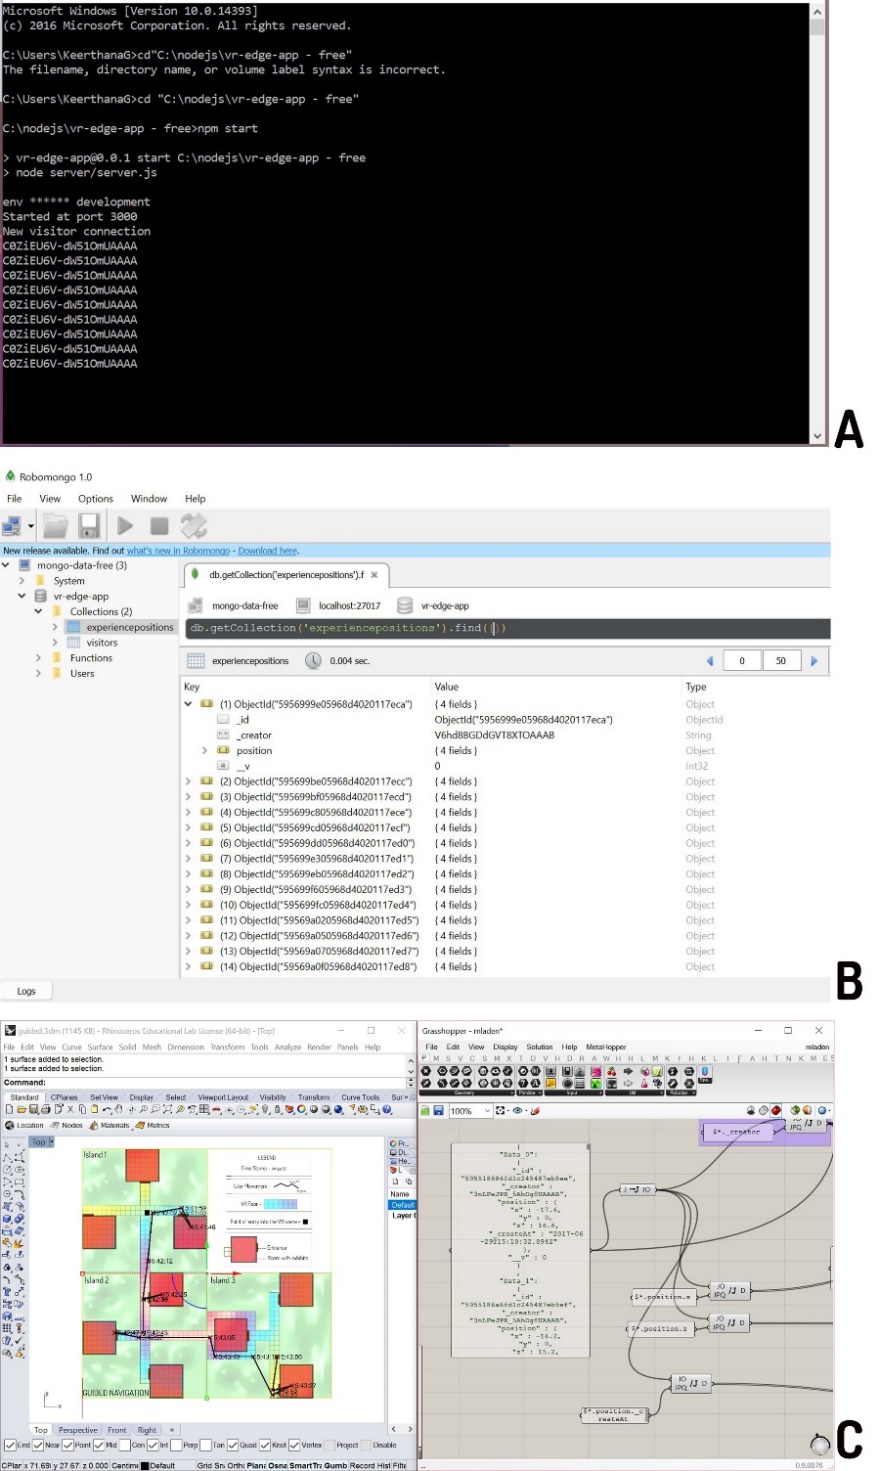
Figure 4 – A- shows the command prompt running the tracking app. B- shows the database used to store the information. C- shows the collected data visualized with grasshopper components.
4.3. Stage 3 – Visualizing the data collected
The data collected by the tracking app is in JSON format (Figure 5). An example of the data collected can be found in the appendix here. It consists of position coordinates, a unique creator ID and the timestamp of each click. It is parsed and the data is visualized using Grasshopper (Figure 4). With the spatiotemporal data captured, movement patterns of a user can be visualized again in VR by repeating stage 1. This could help the architect retrace steps taken by a user. Figure 6 shows the code programmed for visualizing the data.
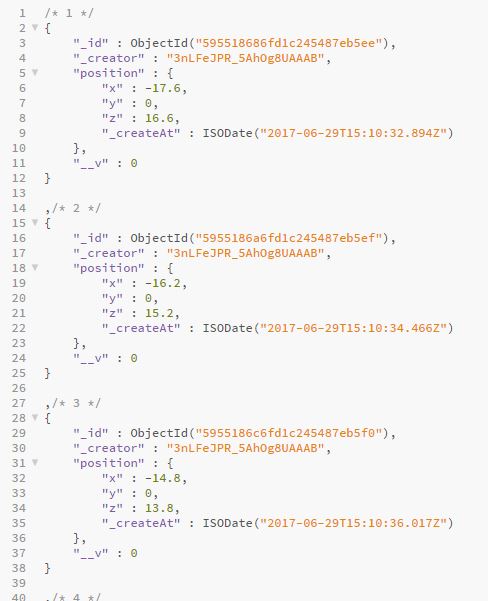
Figure 5 – JSON file showing each click’s Coordinates, UserID and Timestamp
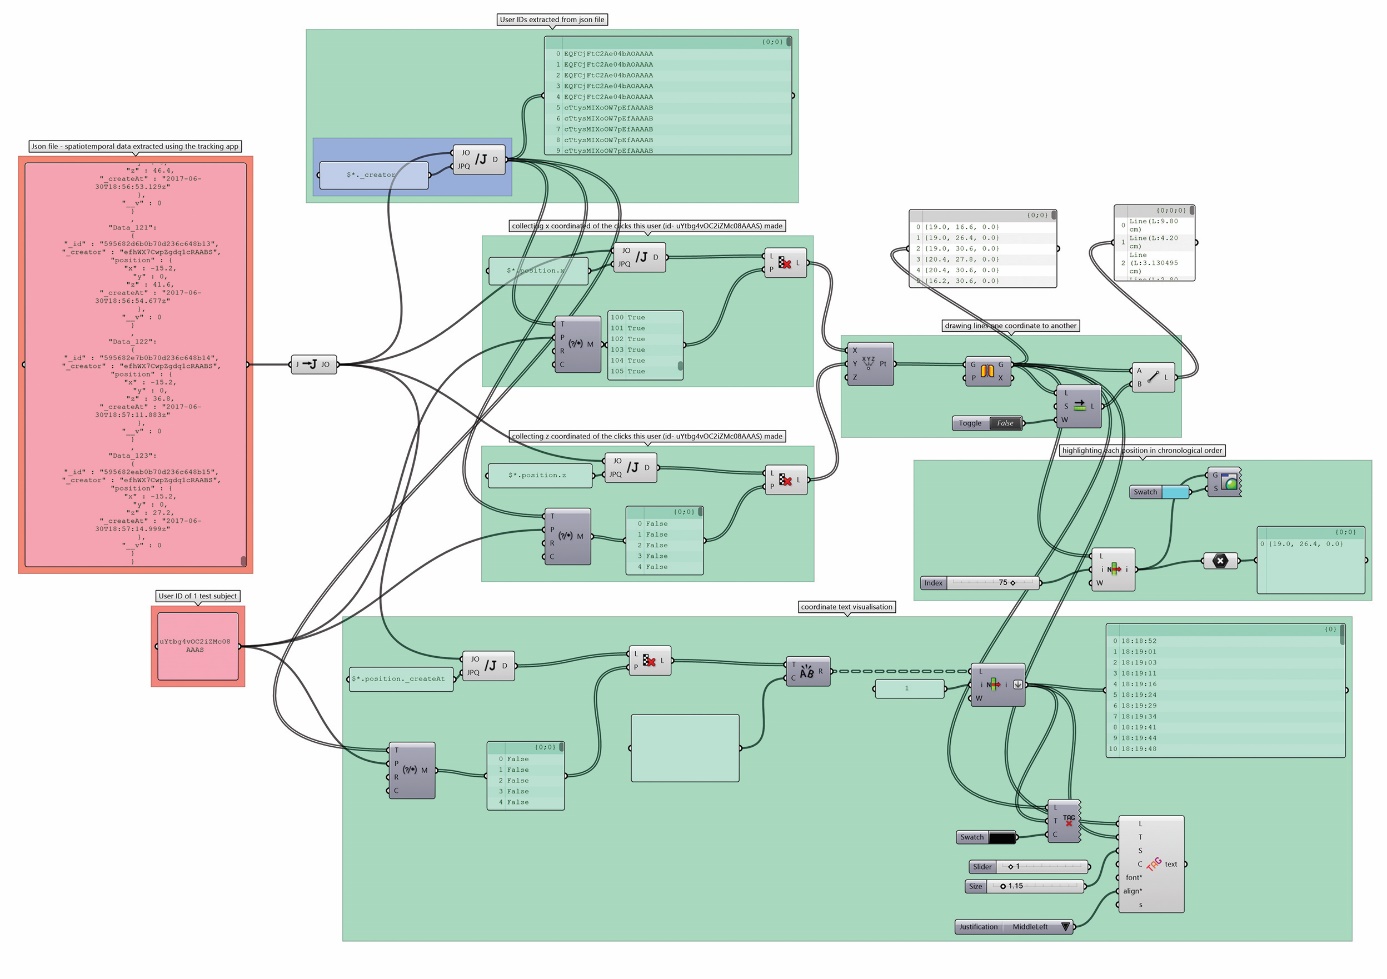
Figure 6 – Data from JSON parsed and visualized using Grasshopper
5. Demonstration of Prototype
Using the framework mentioned in the previous section, an experiment was conducted with the primary aim of testing the prototype with the following objectives:
- To study the feasibility of the framework as a behavior research tool.
- To verify the accuracy of data collected.
- To check the user-friendliness of the prototype
5.1. VR experience for the experiment
The scene used for the experiment was designed like a museum experience and contained three small islands (Figure 7) that were connected through a pathway. Each island contained three rooms housing identical, intriguing geometrical objects to observe (Figure 8). The scene was designed for studying pattern 110 from Christopher Alexander’s book “Pattern Language” [9] about main entrances with the aim of comparing the observed behavior of the virtual user against expected behavior. This part of the experiment is not addressed here as it is beyond the scope of this paper.
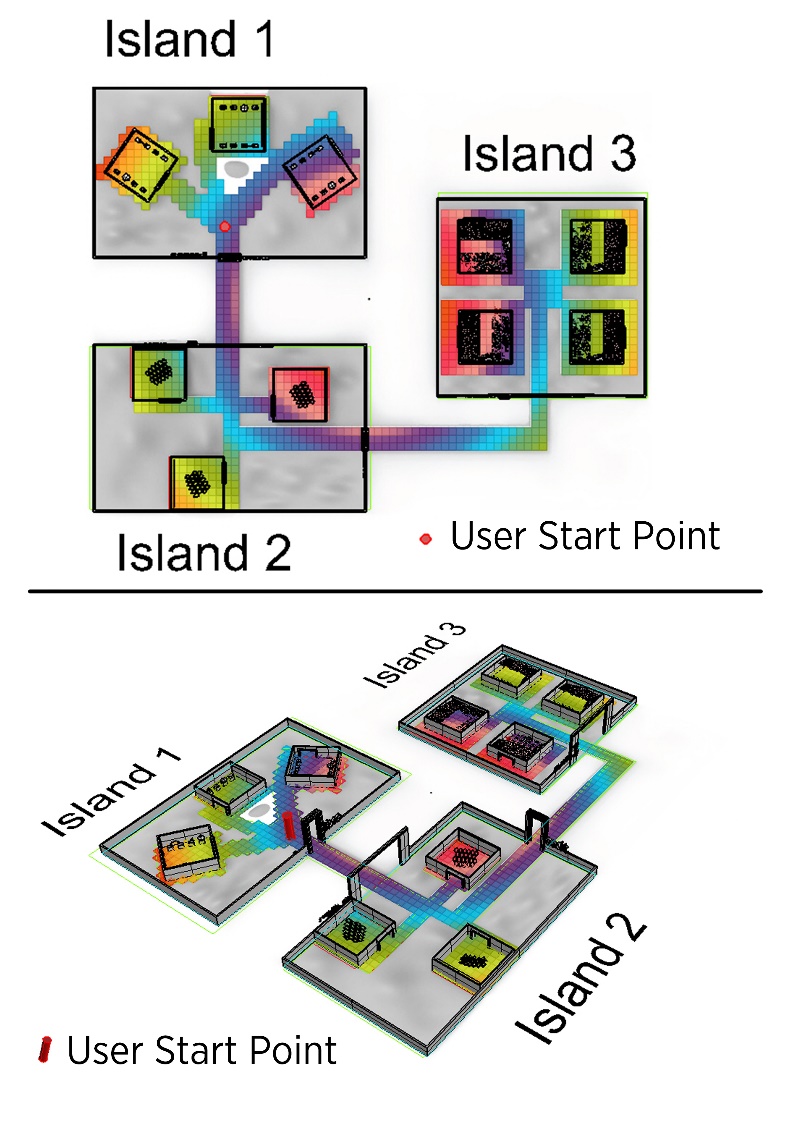
Figure 7 – Plan view (above) and isometric view (below) of the VR Scene. Users can move within the colored portion of the floor.

Figure 8 – A- A view of the VR scene; B- Objects displayed in island 1
C- Convoluted polygonal surfaces exhibited in island 3; D- Complex Geometry presented in island 2
5.2. Collecting data from the participants
A set of 10 users from varying backgrounds and ages ranging from 20 to 45 participated in the study. The experiment was conducted with each participant individually for close observation. The VR scene was hosted on a laptop, which acts as the local server and VR Box, a VR HMD, was given to the participants. Participants used their own mobile phones to access the webpage. The procedure of this one-on-one experiment is as follows:
- Each participant was briefed about the objectives of the study, given general instruction on how to use the VR headset and teleport within the scene.
- They were then informed that the scene they were about to experience contained three islands in total with three rooms each, that they were free to explore.
- The participant was asked to wear the HMD. The VR scene was opened in the participant’s smartphone and was then placed inside the VR Box headset.
- The participant then begins their VR experience as the tracking app records the spatiotemporal data.
- The unique user ID of the participant and the start time of the experience is reported separately.
- Once the participant finishes the experience, the end time is reported, and the phone is removed first followed by the HMD. The VR webpage is closed on the participant’s phone.
- After the experiment, the participant was asked to fill out a questionnaire with questions on the user’s personal data, on spatial perception and about the overall quality of the experience.
5.3. Data visualization
The collected data is visualized and superimposed on the plan view of the VR model. A sample of the data that can be collected is presented. Figure 9 shows the movement pattern of user A visualized on the plan view of the 3D model. The circles denote the clicks and the connecting lines, color coded from green to red, help convey the chronological order of the clicks. Figure 10 depicts the time spent by user A at each clicked point. The circle is bigger and red when more time is spent at a location compared to the green circles. Figure 11 displays all the clicks made by all the users who experienced the scene. It shows the most visited rooms in each island all 10 users put together. Table 1 summarizes the total time spent and the number of clicks made by all the users.
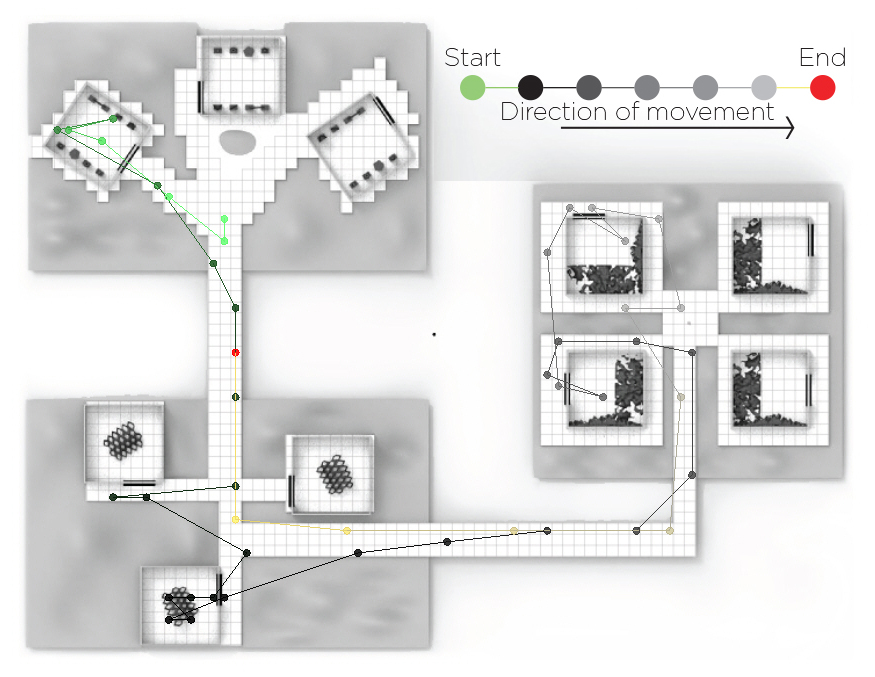
Figure 9 – Movement Pattern of User A
The movement pattern here shows User A navigated from island 1 to island 3 and then back to the halfway point between islands 1 and 2
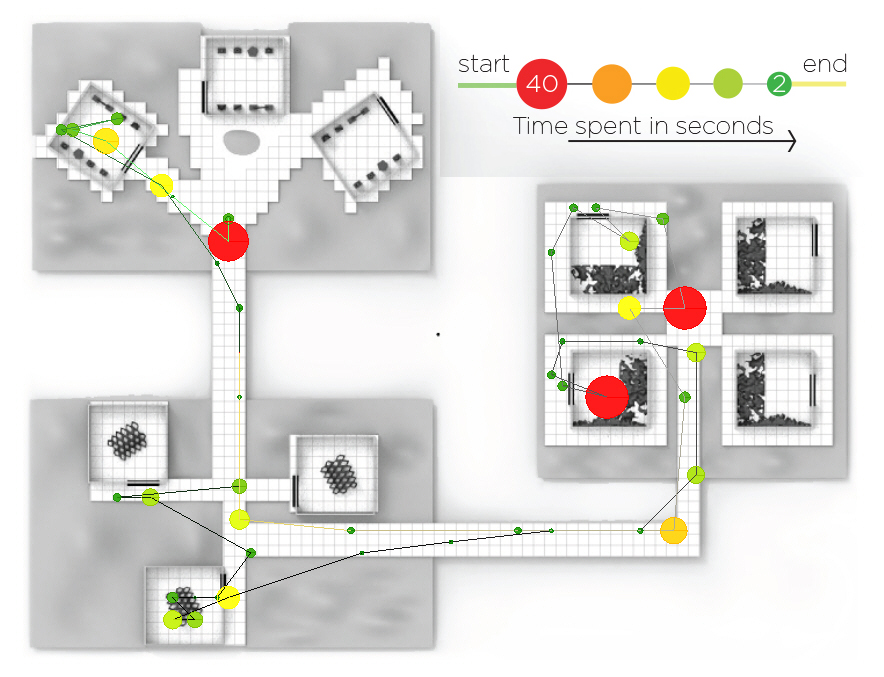
Figure 10 – Time spent by User A at each click location
The data shows the user spent more time viewing objects in island 3 compared to other islands.
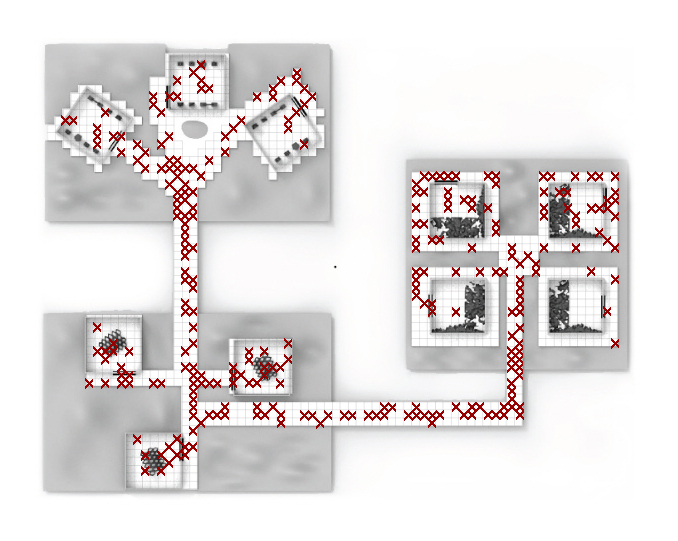
Figure 11 – Cumulative clicks of all users
This map shows areas of the scene least and most visited by all users.
Table 1 Summary of Time spent and clicks by all users
| Max time spent by user in scene | 7m 23s |
| Min time spent by user in the scene | 2m 23s |
| Max No. clicks to navigate the VR | 56 |
| Min No. clicks to navigate the VR | 23 |
| Max time spent per click | 32s |
| Min time spent per click | 2s |
6. Observations
This section summarizes the observations made related to the objectives, while implementing the prototype.
6.1. Feasibility
The process to create the VR experiment was seamless as it was easy to use the VR edge plugin to generate the Web VR experience from a modeled scene, by following the documentation. The scene creation was an iterative process that required understanding of the size and color gradient of the VR boxes on the floor and scale of the model in relation to the VR boxes. The VR scene was quick to load and rendered smoothly without glitches throughout the experiment.
The data collection process, Phase 2, was also seamless, with no issues in using the tracking app or categorizing the data collected for each person. The use of the tracking app to record and store data demanded familiarizing additional technical knowledge as this feature is still under development. When incorporated within the Grasshopper environment, this would be avoided. There was no compatibility issue observed between the VR model and various smartphones of the participants.
6.2. Data Accuracy
Accidental clicks were made when inserting and removing the phone from the HMD and these instances had to be carefully culled from the database. This was achieved by recording the start and end time of the experience manually. The accuracy of individual and collective data provided insights on the most and least visited rooms, the popularity ranking of the objects based on the time spent viewing them, most used paths and more.
6.3. User Feedback
Users, even without prior VR exposure, easily handled the VR experience following a simple explanation of the scene and teleportation method, supporting that the prototype is user-friendly. All participants were able to navigate at their first attempt without any issues or additional guidance. The survey showed that most participants did not experience motion sickness. Most participants also felt the spatial proportions and scale were realistic except for one tall participant who mentioned the urge to duck under doorways.
7. Limitations
VR Edge is currently capable of producing raw models with solid color or color gradients without material characteristics. Model texturing and manipulation of lighting are not possible with this plugin. The scene is a passive VR environment where the user cannot interact with the objects. Web VR is a hyper-simplified version of reality – it caters largely to the senses of sight and sound but lacks the senses of smell and touch. More study of users of VR edge is required to fully understand this plugin’s limitations in shape generation. Given these limitations, its application in practice could be limited.
As the experiment was conducted one-on-one, erroneous clicks made when setting up the experiment were culled manually, but without an alternative data cleaning strategy to deal with it, deliverability of the prototype is severely limited. Furthermore, VR navigation is cursor controlled and does not mimic the way humans interact in physical spaces. Humans might not tend to stay in contact with the edges of a space (thigmotaxis – the wall hugging nature of humans [19]) when experiencing an environment in virtual reality. What helps users in wayfinding in a city may not be similar to exploring a virtual world. There is a possibility that users’ behavior within a virtual world misaligns with primordial human instincts. More work is needed to assess if behavior in VR is similar to behavior in a physical world.
8. Conclusion and Perspectives
When presented with a design problem, architects rely on tools like interviews, research, surveys, and participatory design methods to define user needs. As the design progresses through the various phases, from programming to design development to construction, the dialogue with users slowly diminishes. Design is then largely guided by the architect’s experience and intuition along with their knowledge of design theories. Despite information incorporated from POE in future designs, it is not uncommon for spatial perception to deviate from an accepted behavior response derived from design decisions [20]. This problem is mitigated by quantitatively studying buildings’ behavioral and emotional effect on its occupants. But these attempts are still scarce and the instruments used in these studies are not available for all.
Recognizing the need for a system to connect with the end users efficiently during the design process, the potential of web-based VR to fulfill these demands was explored in this paper. It aimed at proposing a behavior analysis tool that introduces architects into the realm of evidence-based architecture, which could include neuroarchitecture.
VR experience uploaded online is easy to share with users and requires just a smartphone and an HMD to view it, making it affordable. The chosen system of software – Rhino 3D, Grasshopper, VR edge plugin – proved simple to use. Collection of data from each user’s VR experience with the help of a tracking app was also tested in an experiment with 10 participants. It recorded reliable users’ position data, making Web VR a practical possibility for behavior research. The experiment shows the kind of data that can be gathered and visualized to make sense of the user’s experience during the design phase and guide the design process. Widespread applicability of such tool also looks promising as users of varying ages and prior VR experiences (including first-time users) were comfortable with the proposed VR system and could quickly learn to navigate within the simulated environment.
The studied VR tool even in its primitive stage with rudimentary graphics, materials, textures and lighting, does an outstanding job at representing the real world for the purposes of behavior testing architectural designs. These issues could be addressed with technological advancements and advent of more robust applications. Moving forward, the procedure to collect and visualize data could be streamlined further. The behavior data collected (with a system in place to avoid accidental clicks) could be made richer with information of the user’s rotational orientation and possibly emotional data from fitness tracking mobile apps and wearables.
While Web VR and the prototype investigated proves to be chiefly advantageous, it does come with its set of limitations and questions to be considered. The combined efforts of fine-tuning and improving the suggested Web VR system, enriching the datasets collected to include both behavioral and emotional data and investigating the quality of behavior in a virtual world will effectively introduce an unprecedented economical tool for evidence-based design in the field of architecture.
Acknowledgment
The author wishes to thank Dr. Yasmine Abbas for her guidance. The author would like to also thank Noumena and developer José Starsk Naya Lara for the user- tracking app.
[1] Dokonal, W., Knight, M., & Dengg, E. (2016). VR or Not VR-No Longer a Question?
[2] Kieferle, J., & Woessner, U. (2015). BIM interactive-about combining BIM and virtual reality-a bidirectional interaction method for BIM models in different environments. In Proceedings of the 33rd eCAADeConference, pp. 69–75.
[3] Kreutzberg, A. (2015, September). Conveying architectural form and space with virtual Reality. In Real Time-Proceedings of the 33rd eCAADe Conference (Vol. 1, pp. 117-124).
[4] Svidt, K. (2016). Development of a Virtual Reality Solution for End User Involvement in Interior Design. In Proceedings of the 34th eCAADeConference on Complexity and Simplicity, vol. 2, pp. 541–546.
[5] Gu, N., Watanabe, S., Erhan, H., Haeusler, M. H., Huang, W., & Sosa, R. (2014). Rethinking Comprehensive Design: Speculative Counterculture.
[6] Gallo, G., & Pellitteri, G. (2018). Luigi Moretti, from History to Parametric Architecture. In Learning, Prototyping, and Adapfing, Short Paper Proceedings of the 23rd International Conference on Computer-Aided Architectural Design Research in Asia CAADRIA (pp. 209-214).
[7] Lynch, K. (1960). The image of the city (Vol. 11). MIT press.
[8] Sitte, C. (1979). The art of building cities: city building according to its artistic fundamentals. Ravenio Books.
[9] Alexander, C. (1977). A pattern language: towns, buildings, construction. Oxford university press.
[10] Erwine, B. (2016). Creating sensory spaces: The architecture of the invisible. Taylor & Francis.
[11] Meyers-Levy, J., & Zhu, R. (2007). The influence of ceiling height: The effect of priming on the type of processing that people use. Journal of consumer research, 34(2), 174-186.
[12] Nanda, U., Chanaud, C., Nelson, M., Zhu, X., Bajema, R., & Jansen, B. H. (2012). Impact of visual art on patient behavior in the emergency department waiting room. The Journal of emergency medicine, 43(1), 172–181. https://doi.org/10.1016/j.jemermed.2011.06.138
[13] Edelstein, E. A., & Macagno, E. (2012). Form follows function: bridging neuroscience and architecture. In Sustainable environmental design in architecture (pp. 27-41). Springer, New York, NY.
[14] Bissell, J., Eyres, J., Gulwadi, G. B., Harper, E., Kirk, N., Lee, S., … & Yoon, H. (2015, May). Environmental design research association. In Proceedings of the 46th Annual Conference of the Environmental Design Research Association Los Angeles, California May (pp. 27-30).
[15] Kim, J. Y., & Lee, H. S. (2004). Developing a Color Adaptive VR Interior Design System Based on Psychophysiological Responses.
[16] Bower, I., Tucker, R., & Enticott, P. G. (2019). Impact of built environment design on emotion measured via neurophysiological correlates and subjective indicators: A systematic review. Journal of environmental psychology, 66, 101344.
[17] Eberhard, J. P. (2009). Brain landscape the coexistence of neuroscience and architecture. Oxford University Press.
[18] Chow, H. W., & Yang, C. C. (2020). Accuracy of Optical Heart Rate Sensing Technology in Wearable Fitness Trackers for Young and Older Adults: Validation and Comparison Study. JMIR mHealth and uHealth, 8(4), e14707.
[19] Sussman, A., & Hollander, J. B. (2014). Cognitive architecture: Designing for how we respond to the built environment. Routledge.
[20] Zeisel, J. (2006). Inquiry by design. Environment/behavior/neuroscience in architecture, interiors, landscape, and planning.
